Protocol
This page outlines the protocol implemented in Bartelt 2021 Masters thesis
Overview
For each site, the protocol can be broken into 3 main steps:
- Imagery Acquisition
- Mapping Features
- Calculating Metrics
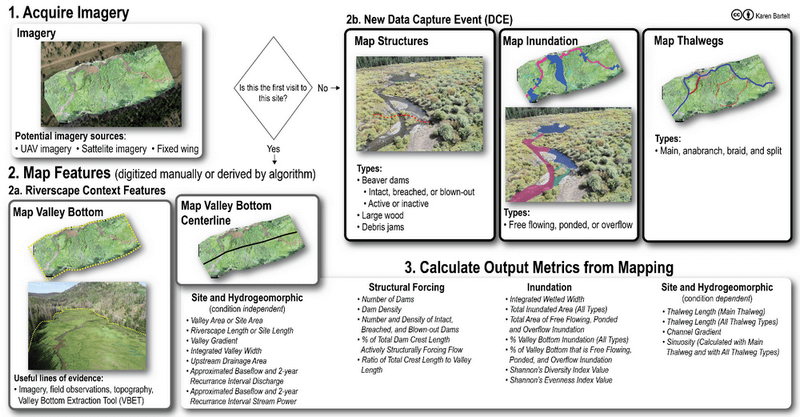
Imagery Acquisition

- Use Drone deploy (or similar software) to create a flight plan covering the full length and lateral extent of the site or project area
- Field visit to collect imagery
- Follow the instructions here to upload and process the drone photos and generate a 2cm orthomosaic
Map Features
Create RIM Project
Map Riverscape Context Features
Map the riverscape extent. The polygon mapped for the riverscape or valley bottom extent will represent the site extent. These features will later be used to characterize the site's hydrogeomorphic setting and for normalization of measurements to allow for intersite comparison.
Map Valley Bottom

Derive Valley Bottom Centerline
Use the ArcGIS Polygon to Centerline tool.

Manually clean up the centerline and make sure it is merged to be a single feature.
Map and Attribute Structurally Forced Features

Map Dam Crests
Beaver dam crests represent the top of the dam, and beavers tend to construct them at a constant elevation, such that when the dam is maintained and full, water spills over the contour of the crest evenly. Digitize the beaver dam crest for each beaver dam by tracing the polyline representing a contour at the crest elevation of the dam (note, if topography is available, these dam crests should connect to cells of equal elevation on the digital elevation model at each end of the crest).

Attribute "dam state" and "crest type"
For each digitized dam crest you will determine two categorical attributes that together help characterize dam condition and beaver dam activity:
- dam state
- crest type
Dam state refers to the condition of the dam and whether it was intact, breached, or blown out at the time of the survey based on definitions by Hafen et al. (2020). For the crest type attribute you will determine the length of the crest that was actively ponding flow at the time of the survey.
Map Thalwegs or Centerlines
To characterize more dynamic hydrogeomorphic attributes such as planform changes (e.g., multi-threadedness and sinuosity) that potentially occur between survey dates, map the location and type of thalwegs in the basemap. If the true thalweg or deepest part of the channel cannot be destinguished from the basemap imagery, then map the centerline of the flow area instead. Digitize the main chananel and overflow channels, including fully formed secondary channels or sheetflow.

Attribute Thalweg or Centerline Type
Each thalweg or centerline type should be determined based on the following definitions that were adapted from the definitions used for the [Geomorphic Unit Tool (GUT)] (http://gut.riverscapes.net/)
- Main: the thalweg that follows the primary anabranch
- Anabranch: thalwegs that follow a fully formed (i.e. has an active channel bed) secondary anabranch that is longer than an estimated 2 bankfull widths
- Split: thalwegs that follow structurally forced sheetflow areas or short secondary anabranches
- Braid: thalwegs within the primary anabranch that are not the main thalweg and are not structurally forced by large wood or beaver dams. These typically depart and return from the main thalweg
Map Inundation and Attribute Inundation Type
Digitize the wetted extent from the basemap image and characterize inundation type as free flowing, ponded, or overflow based on the definitions shown in the image below.

Calculate Metrics
Use RIM to calculate summary metrics based on the features you mapped
