Examples of Inundation
Beaver Dam Building Opportunities
In Figure 2 and Appendix A of Bartelt (2021), 'Beaver Dam Building Opportunities' are differentiated into classic, steep and floodplain.
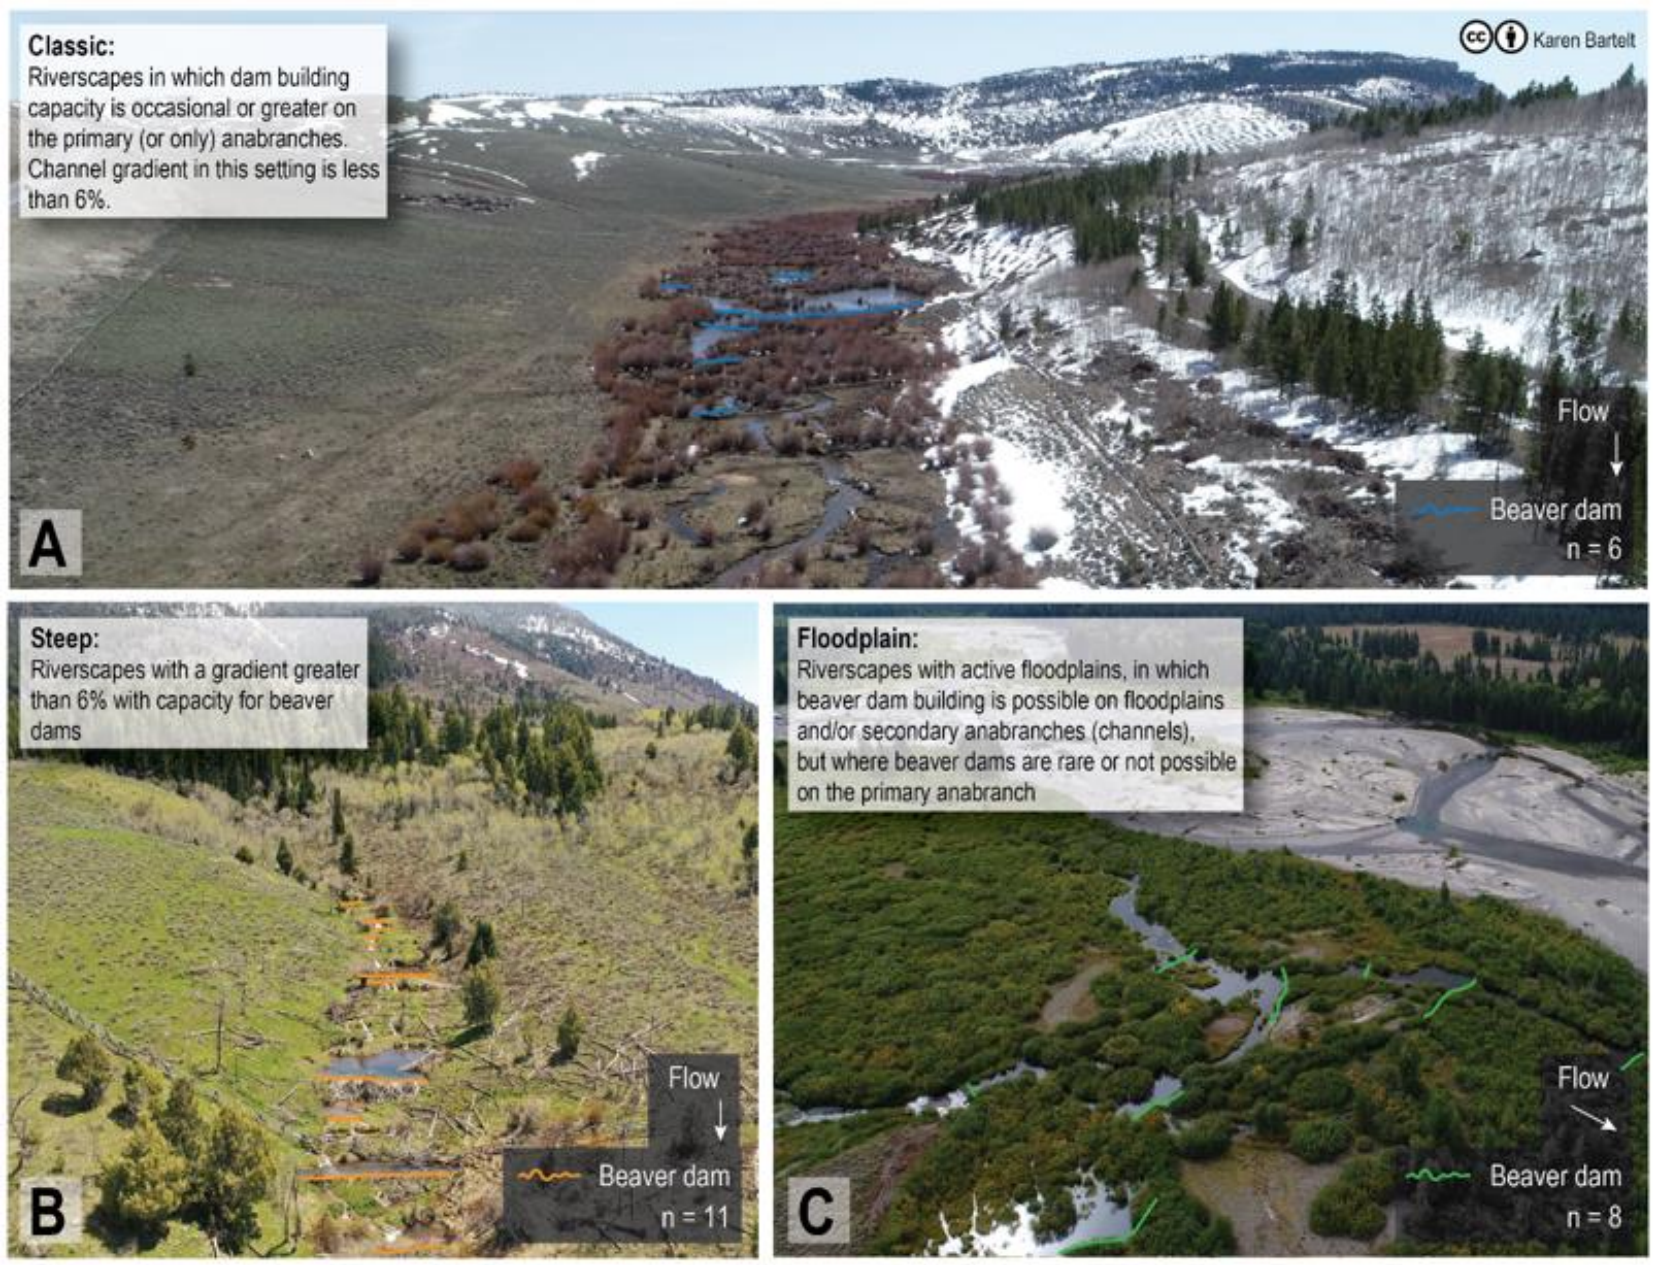
Did you know that in the new Riverscape Network verson of BRAT 5.0 there is a new intermediate output Beaver Dam Setting layer that has these estimates of classic, steep and floodplain beaver dam building opportunties.
Explore and download these models in the Data Exchange for all of CONUS!
Schematics of Inundation Contrasted
In each of the 36 sites below, schematics of inundation within the valley bottom (white) are shown as pairs with the same site without beaver dam activity on top, and with beaver dam activity on the bottom. This is the primary mapping result of RIM (i.e. digitizing inundation extent). In each figure, the first column are sites within classic settings (i.e. < 6% slope and damming main channel), steep settings (>6% slope) and floodplain settings (dams primarily on floodplain and side channels). citation.
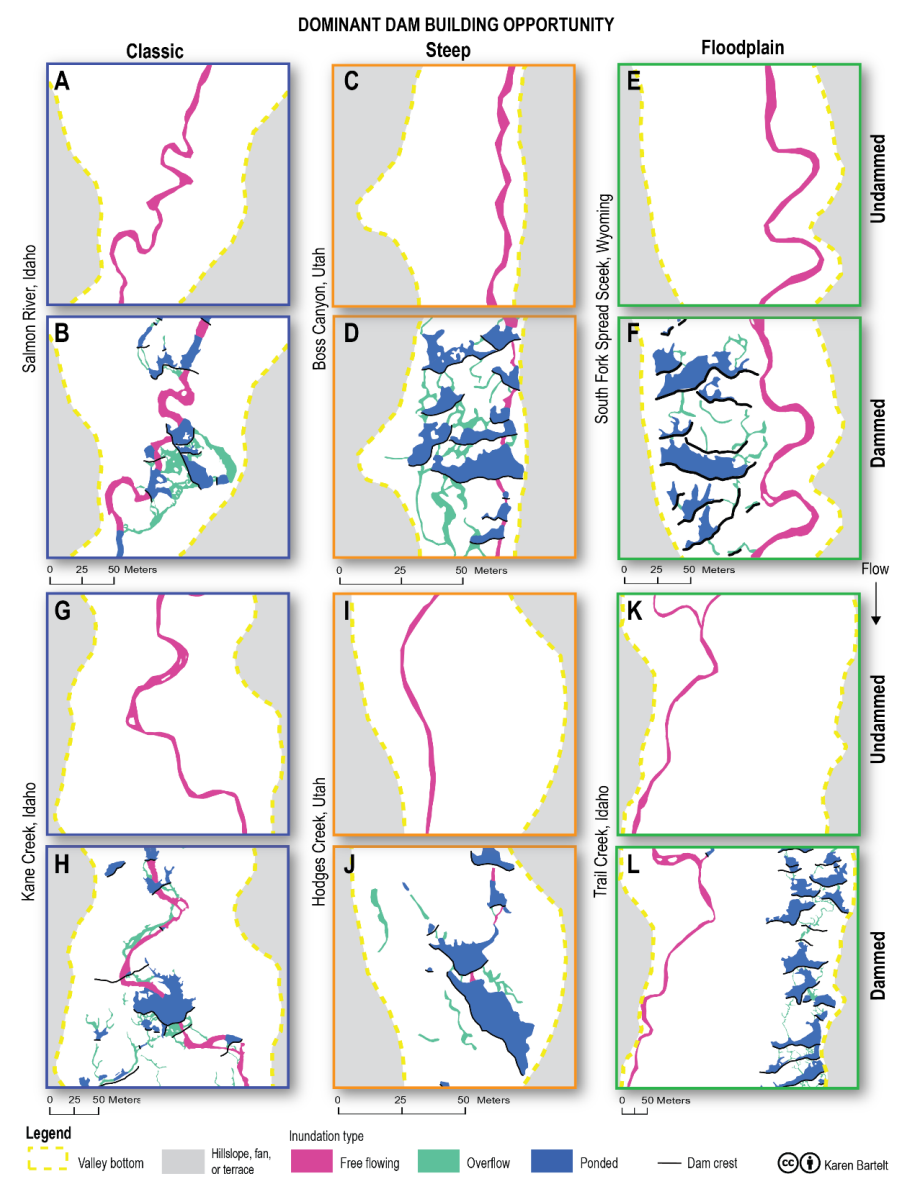
Figure 7
Figure 7 of Bartelt et al. (2021)
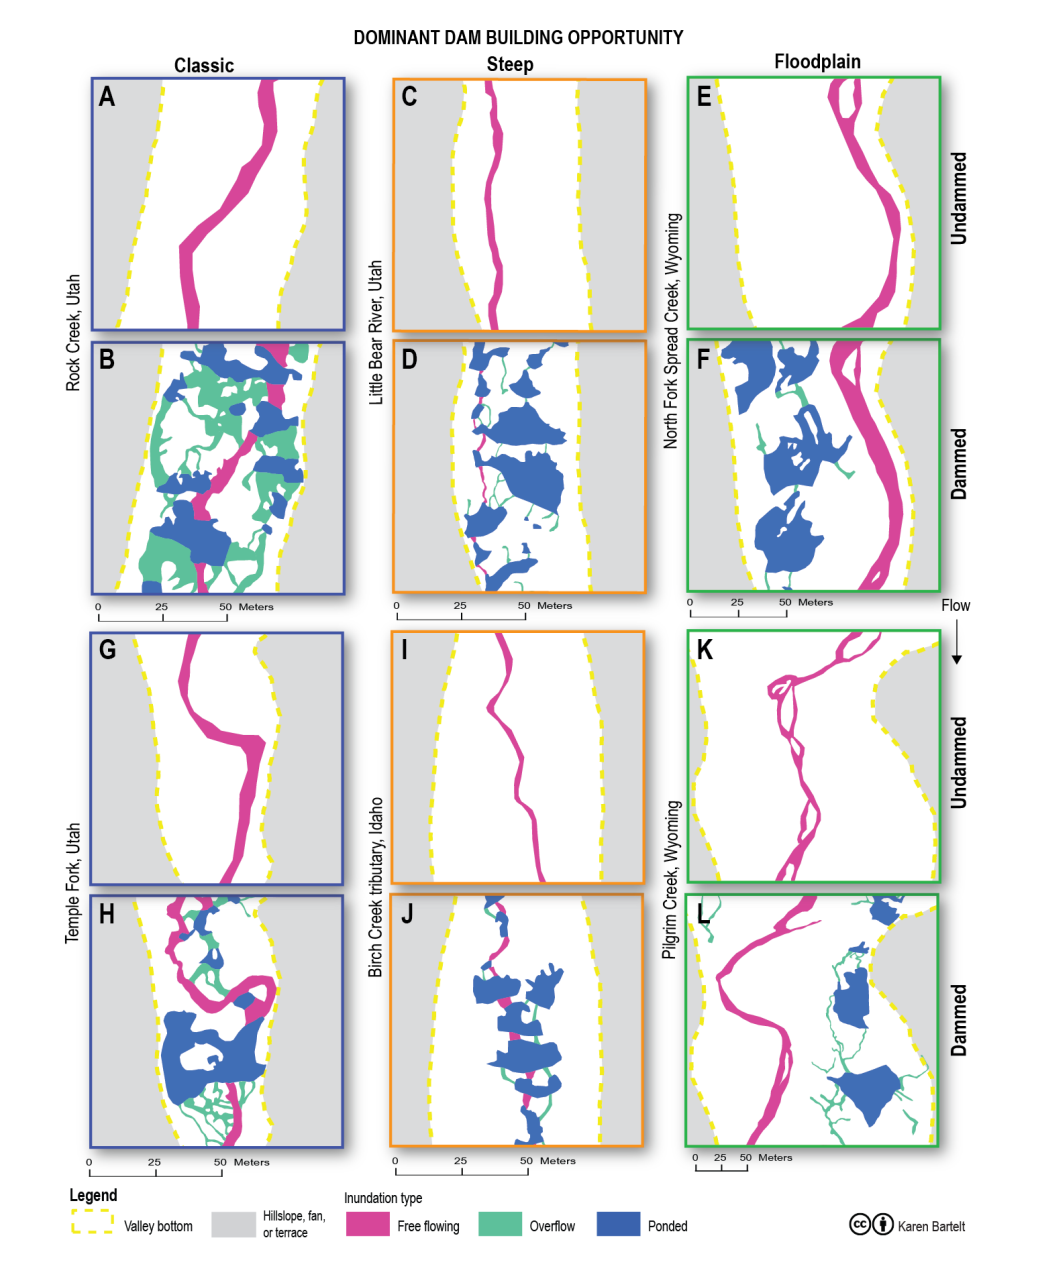
Figure 8
Figure 8 of Bartelt et al. (2021)
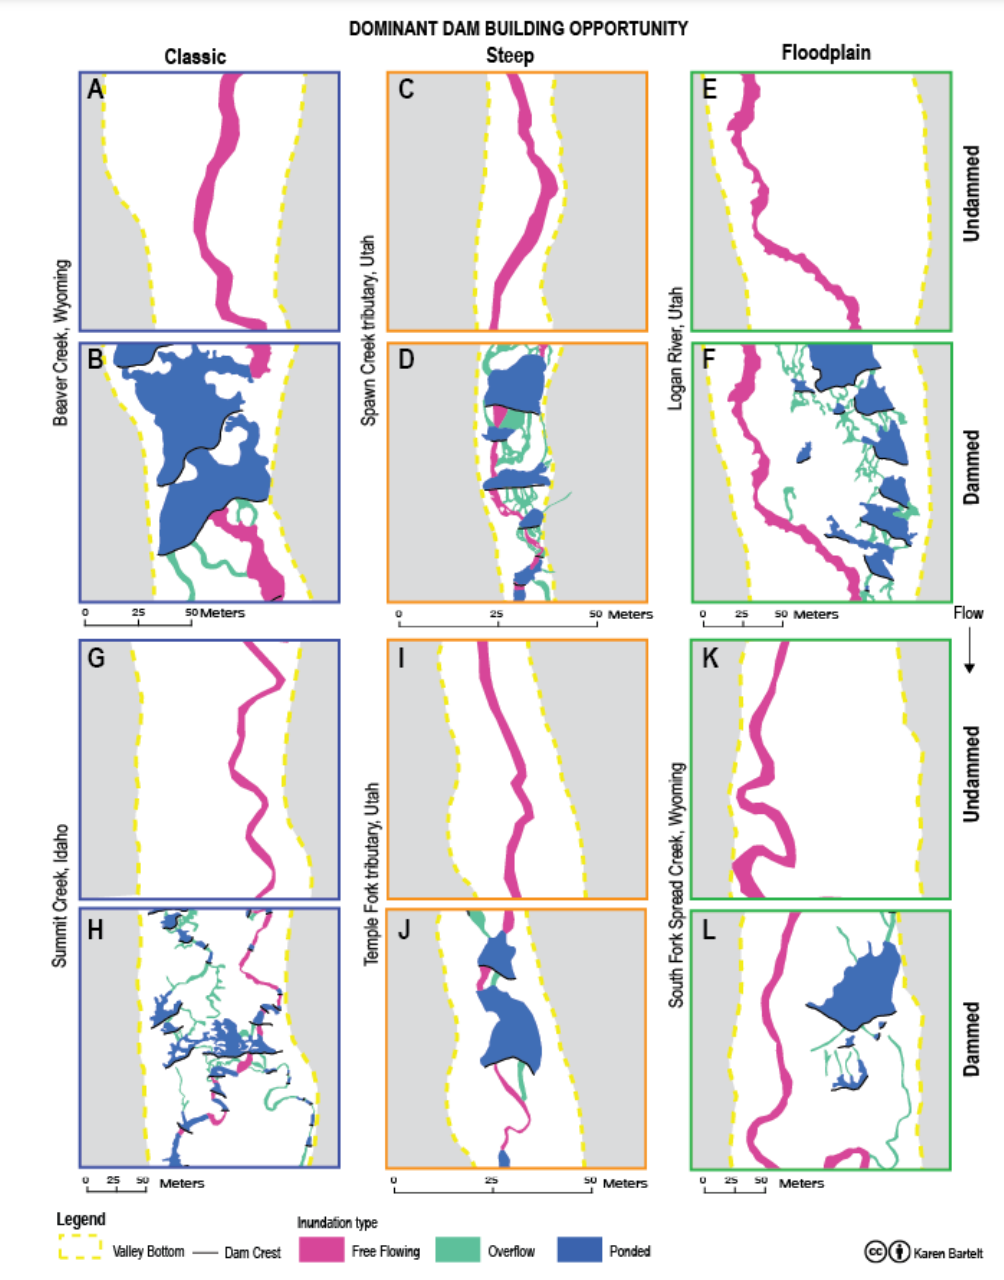
Figure B1
Figure B1 of Bartelt et al. (2021)
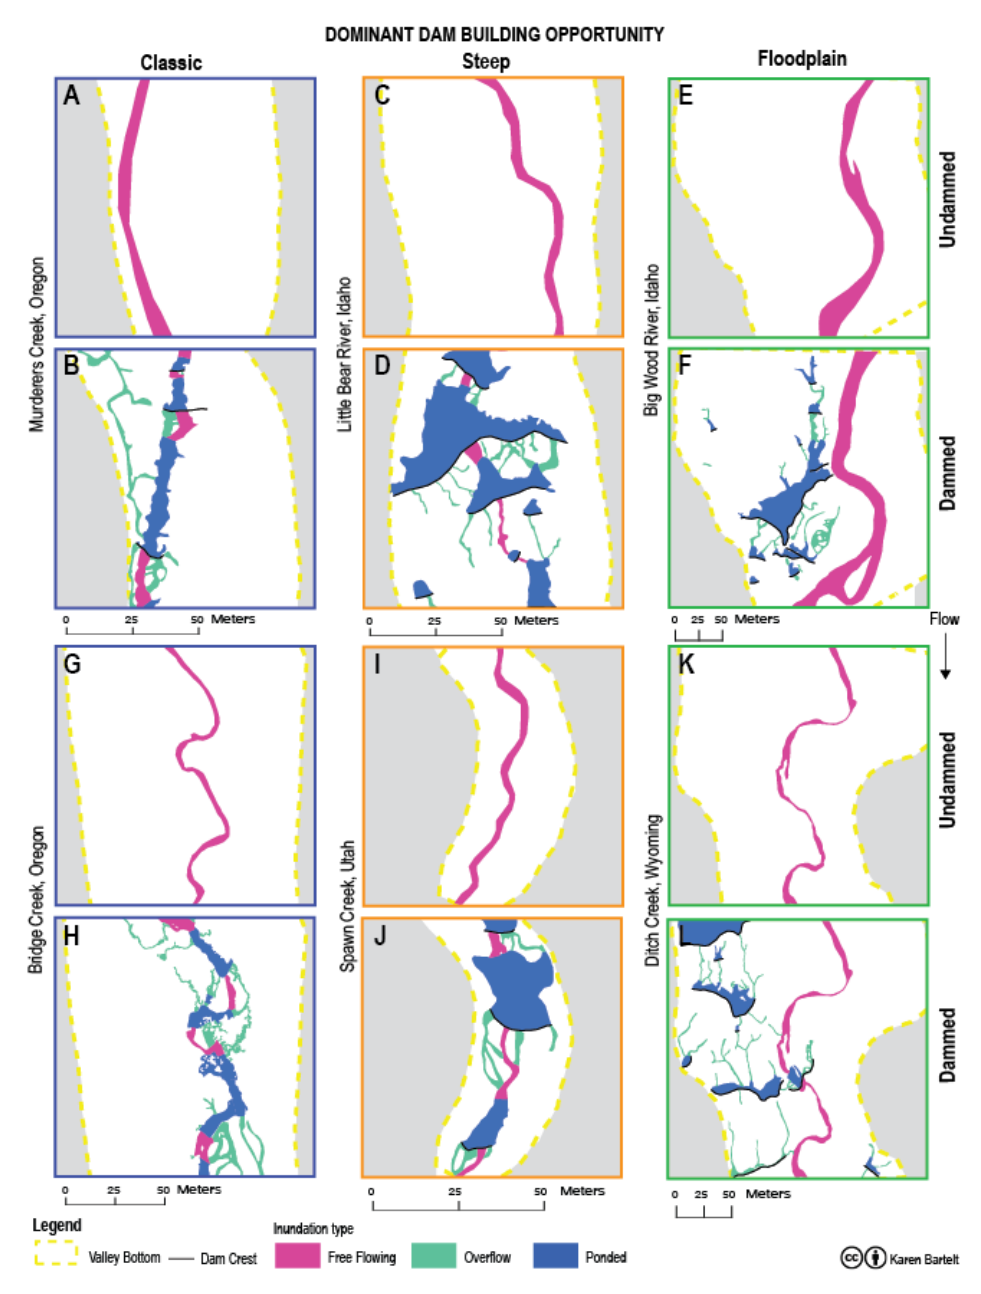
Figure B2
Figure B2 of Bartelt et al. (2021)
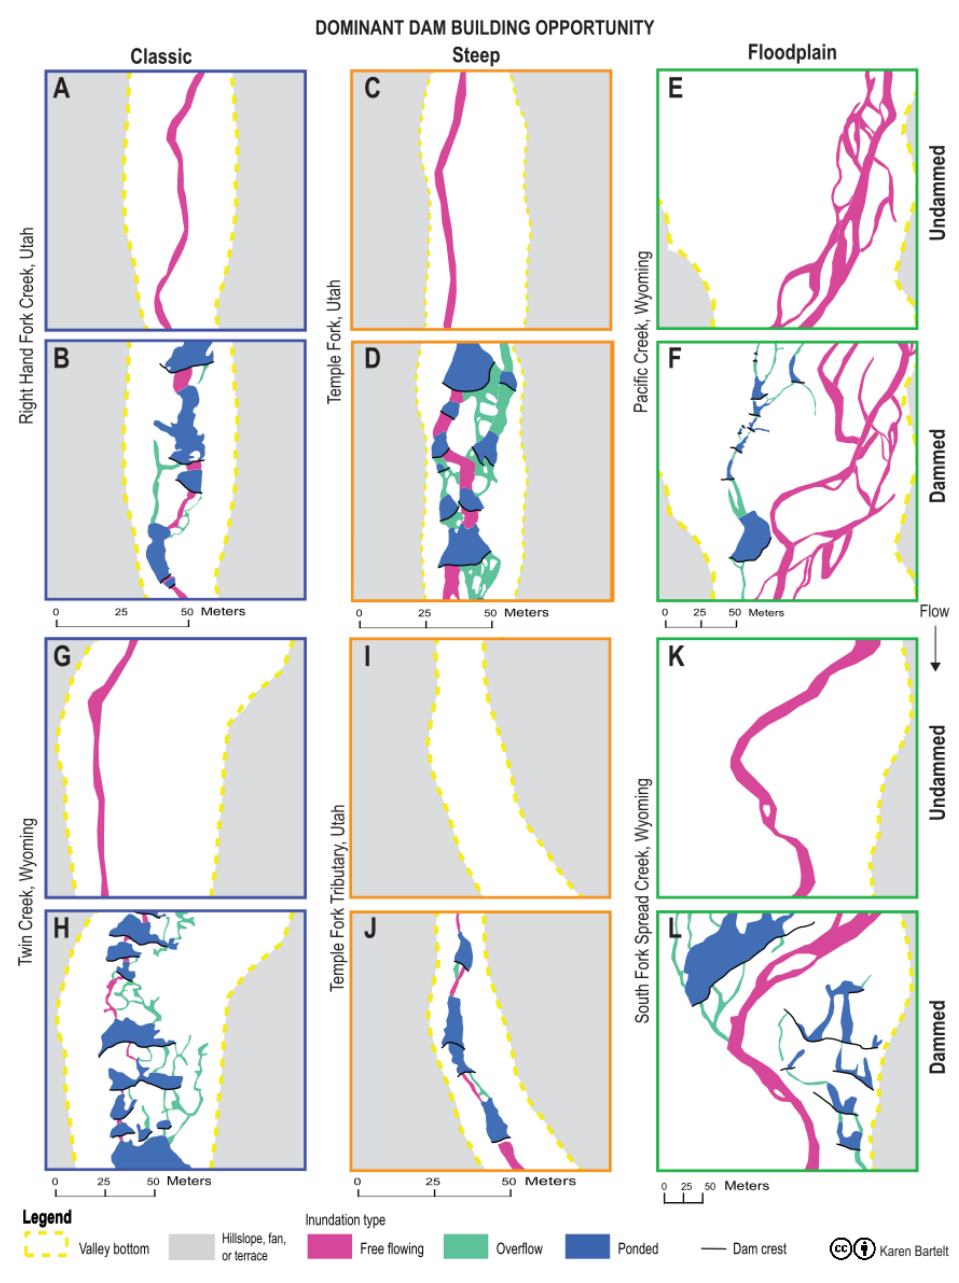
Figure B3
Figure B3 of Bartelt et al. (2021)
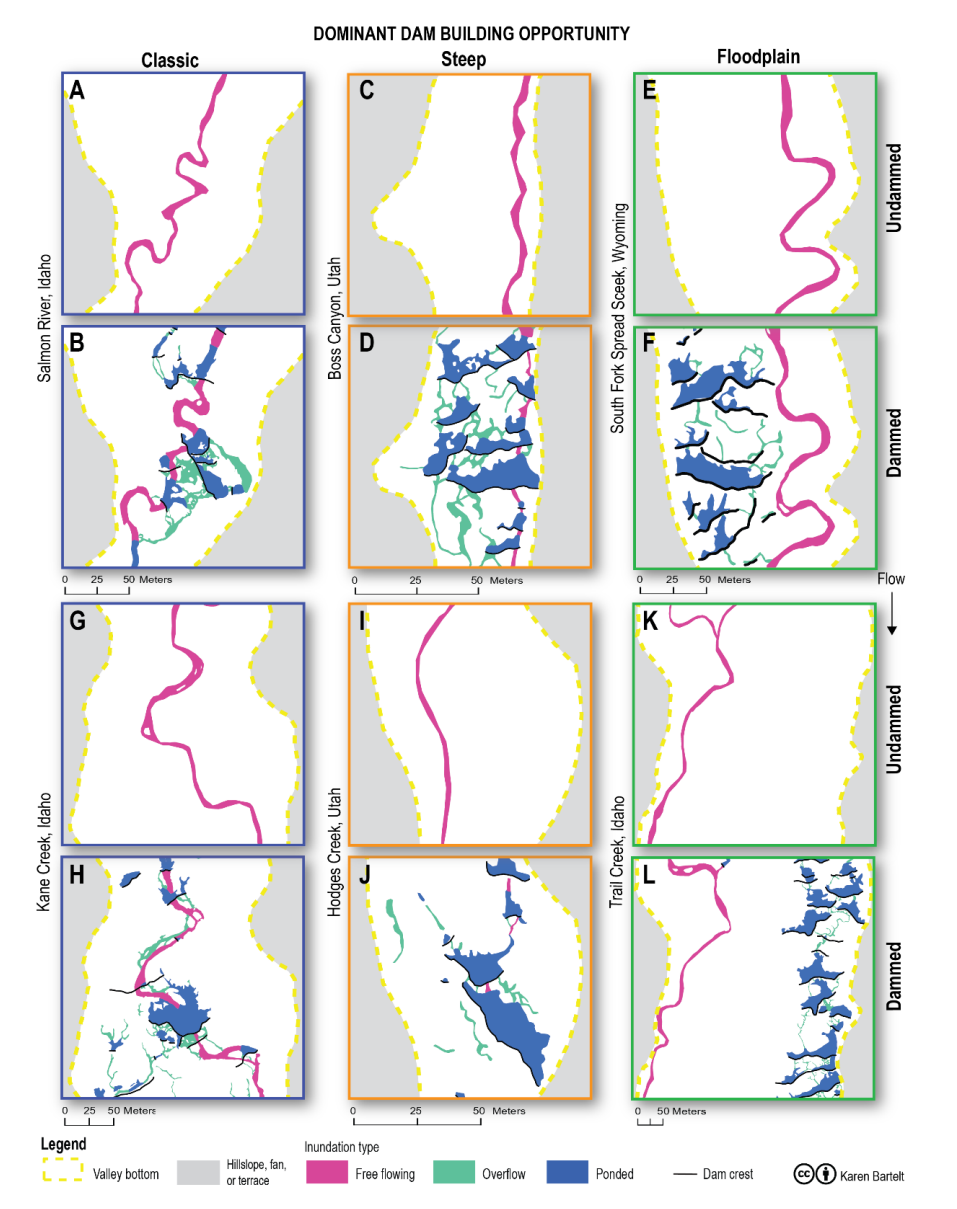
Figure B4
Figure B4 of Bartelt et al. (2021)
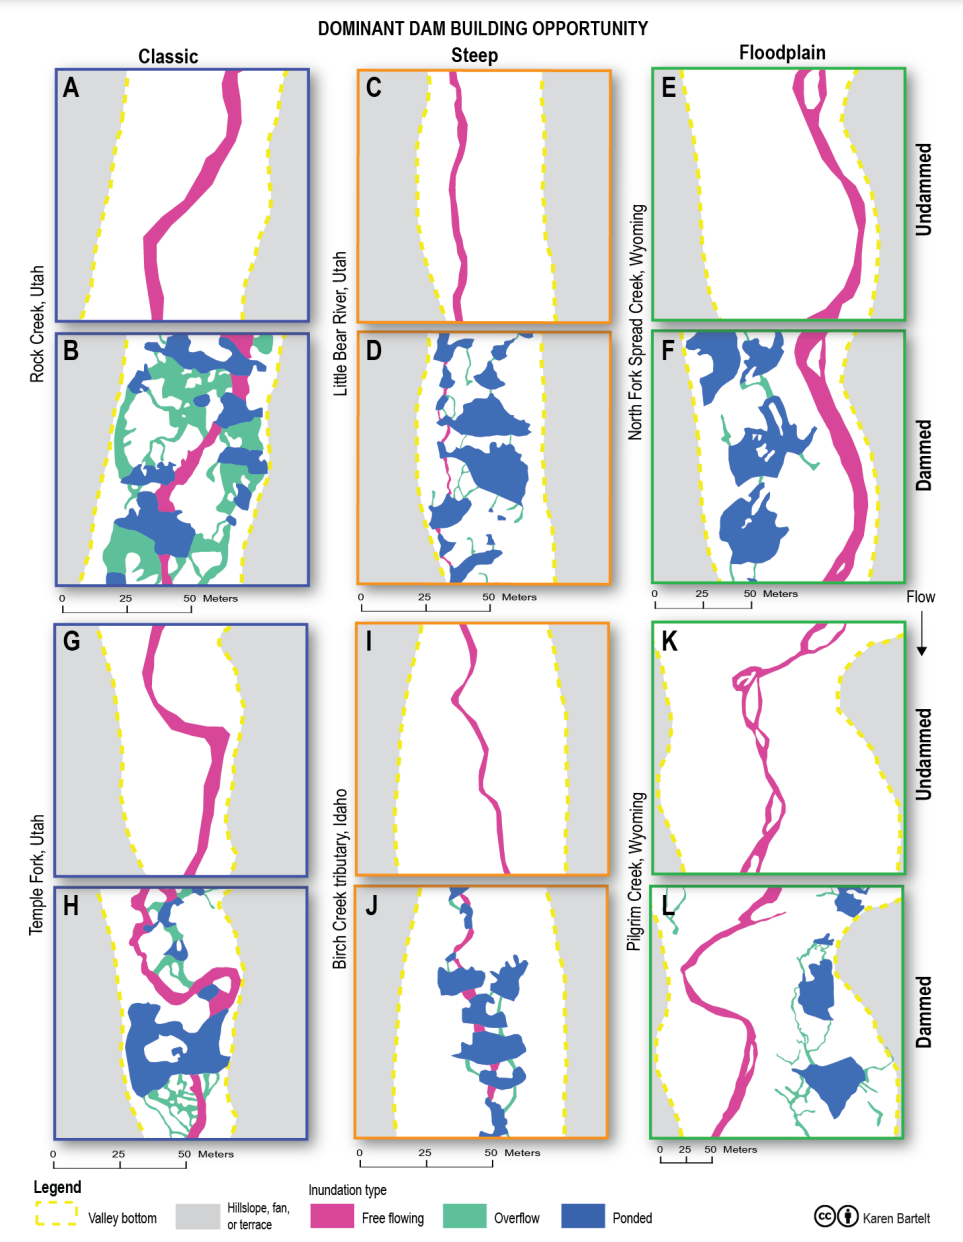
Figure B5
Figure B5 of Bartelt et al. (2021)
You can explore the above results (just schematics of inundation shown as an abstraction) in more detail at:
View or Download Projects
View or Download Projects from Bartelt 2021 using Riverscapes Viewer
References
Bartelt K. 2021. Valley Bottom Inundation Patterns in Beaver-Modified Streams: A Potential Proxy for Hydrologic Inefficiency, Masters Thesis, Utah State University: Logan, UT. Available from: https://digitalcommons.usu.edu/etd/8226